WHO and IAP growth charts, plotted automatically.
Height, weight, BMI, and head circumference, matched to the right standard by age and sex, and trended across every visit — not redrawn by hand from a paper card.
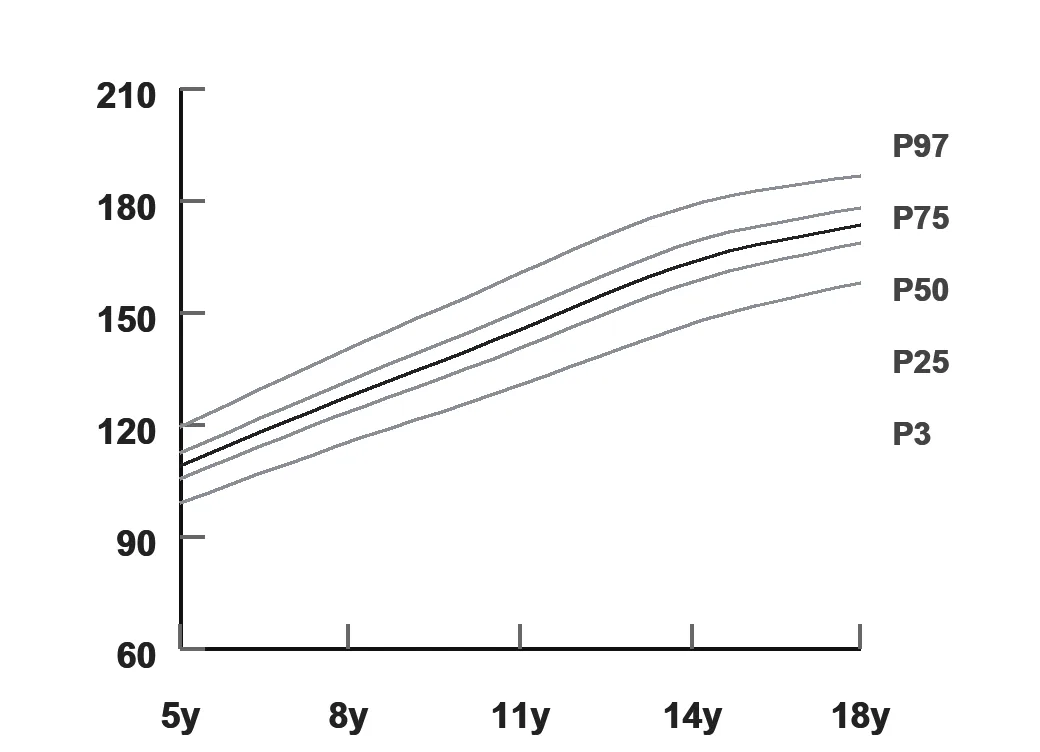
PediaNex growth charts automatically plot WHO percentiles for children under 5 and IAP percentiles for ages 5 to 18, based on the child's age and sex.
WHO standards apply automatically for children under 5, and IAP (Indian Academy of Pediatrics) standards for ages 5 to 18. PediaNex picks the correct chart the moment you enter a birthdate and sex — no manual lookup, no separate paper chart book on the desk.
Every measurement plots instantly on screen against the right percentile curve, then renders again as a clinic-grade PDF you can print or send. Because every visit's vitals are already in the record, the chart trends the child's growth over time automatically, instead of asking a parent to remember last visit's numbers.
Before this, plotting a percentile meant flipping to the right page of a WHO or IAP reference booklet, finding the curve for the child's age and sex, and marking the point by eye. That works, but it's slow on a busy OPD day, and it's easy to reach for the wrong chart when a child crosses from the WHO to the IAP range around age five. PediaNex removes the lookup step: enter a birthdate and sex once, and every measurement from then on plots against the correct standard automatically.
BMI is calculated from height and weight rather than worked out by hand, and head circumference is charted the same way, which matters most for infants and toddlers where it's tracked at nearly every visit. Because the last several visits are always on screen together, a doctor can see whether a child is tracking along their usual curve or has started to drift, instead of comparing numbers from memory.
Still tracking growth on a paper percentile card?
Book a walkthroughWhat's tracked, on every visit.
Two standards, matched automatically
WHO for children under 5, IAP for ages 5 to 18 — PediaNex switches the moment a birthdate crosses the line, no manual lookup.
Four metrics per visit
Height, weight, BMI, and head circumference — all charted, not just recorded as a number in a table.
Plotted live, mid-visit
Each measurement lands on the correct percentile curve the moment it's entered — no flipping through a reference booklet.
Clinic-grade PDF export
Every chart renders on screen and again as a print-ready PDF, so a copy can leave the room with the family.
Trend, not a single point
The last several visits sit on screen together, so a doctor sees whether a child is tracking their curve or has started to drift.
BMI calculated, not hand-worked
Height and weight are enough — PediaNex does the BMI math and plots it on its own curve automatically.
Questions about growth chart tracking.
Which growth standard does PediaNex use?
WHO standards for children under 5, and IAP (Indian Academy of Pediatrics) standards for ages 5 to 18. PediaNex picks the right chart automatically based on the child's age and sex.
Can I export or print a growth chart?
Yes. Every chart renders on screen and again as a clinic-grade PDF, ready to print or send.
Does it track head circumference too?
Yes — height, weight, BMI, and head circumference are all tracked and plotted across every visit.
See growth charts running on your own sample data.
Twenty minutes, real workflow, no script.
Book a walkthrough or chat with us on WhatsApp →